
It says when there is nothing there
When the chart is genuinely indecisive you get a wait card and what to watch for, not an invented trade plan. Most tools will manufacture a setup because you asked for one.
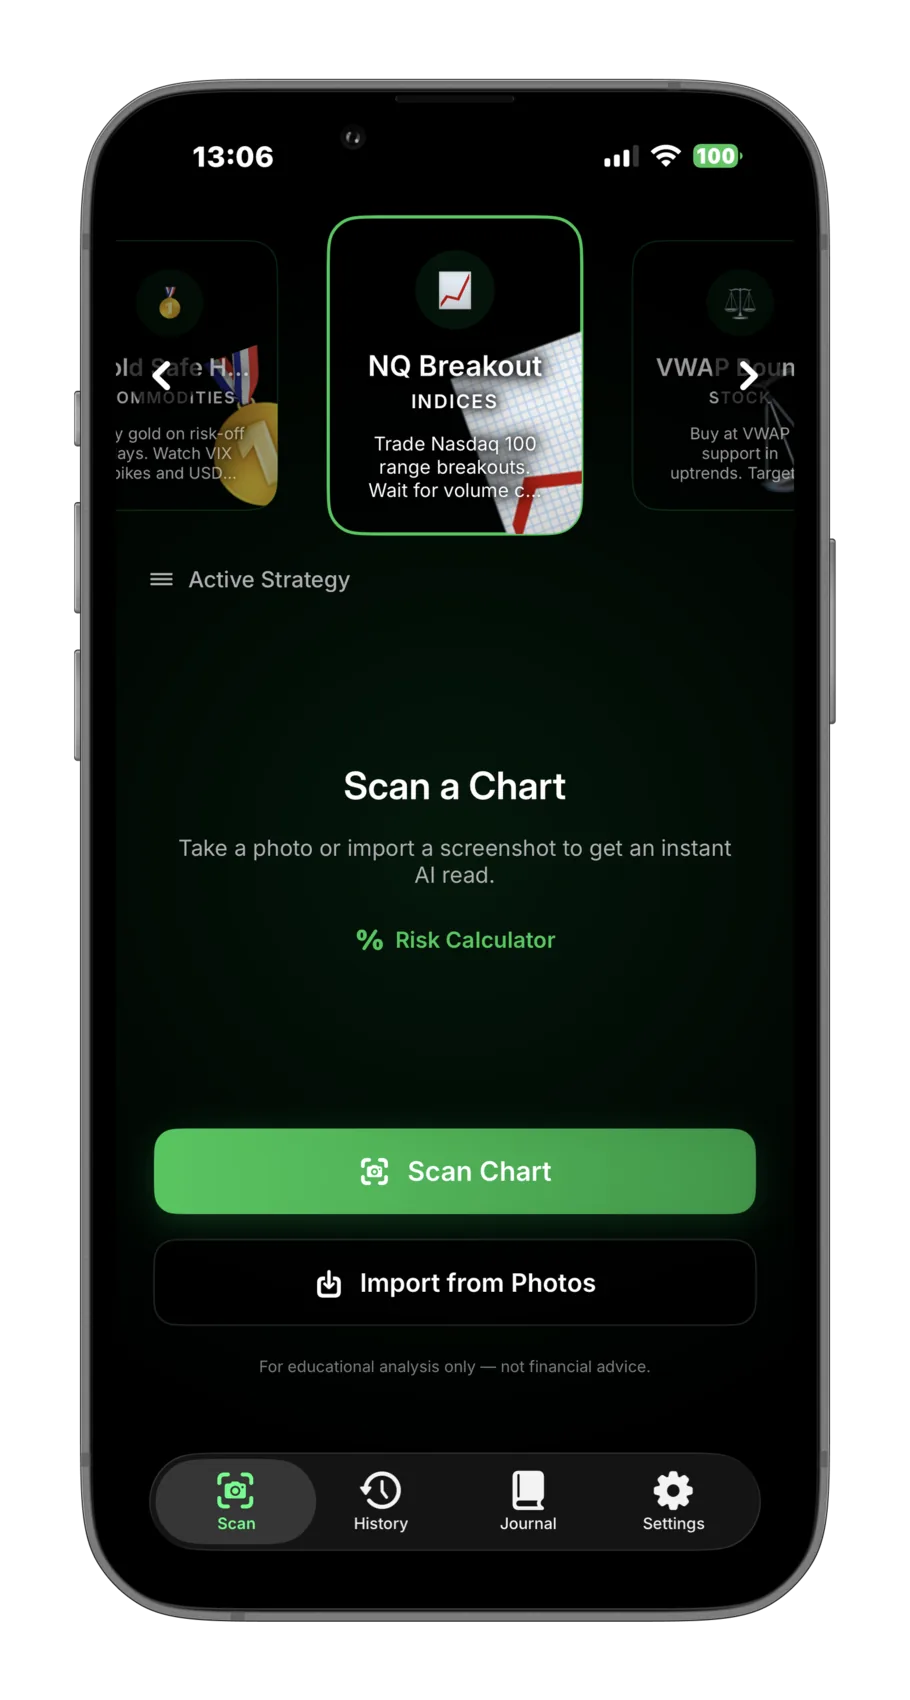
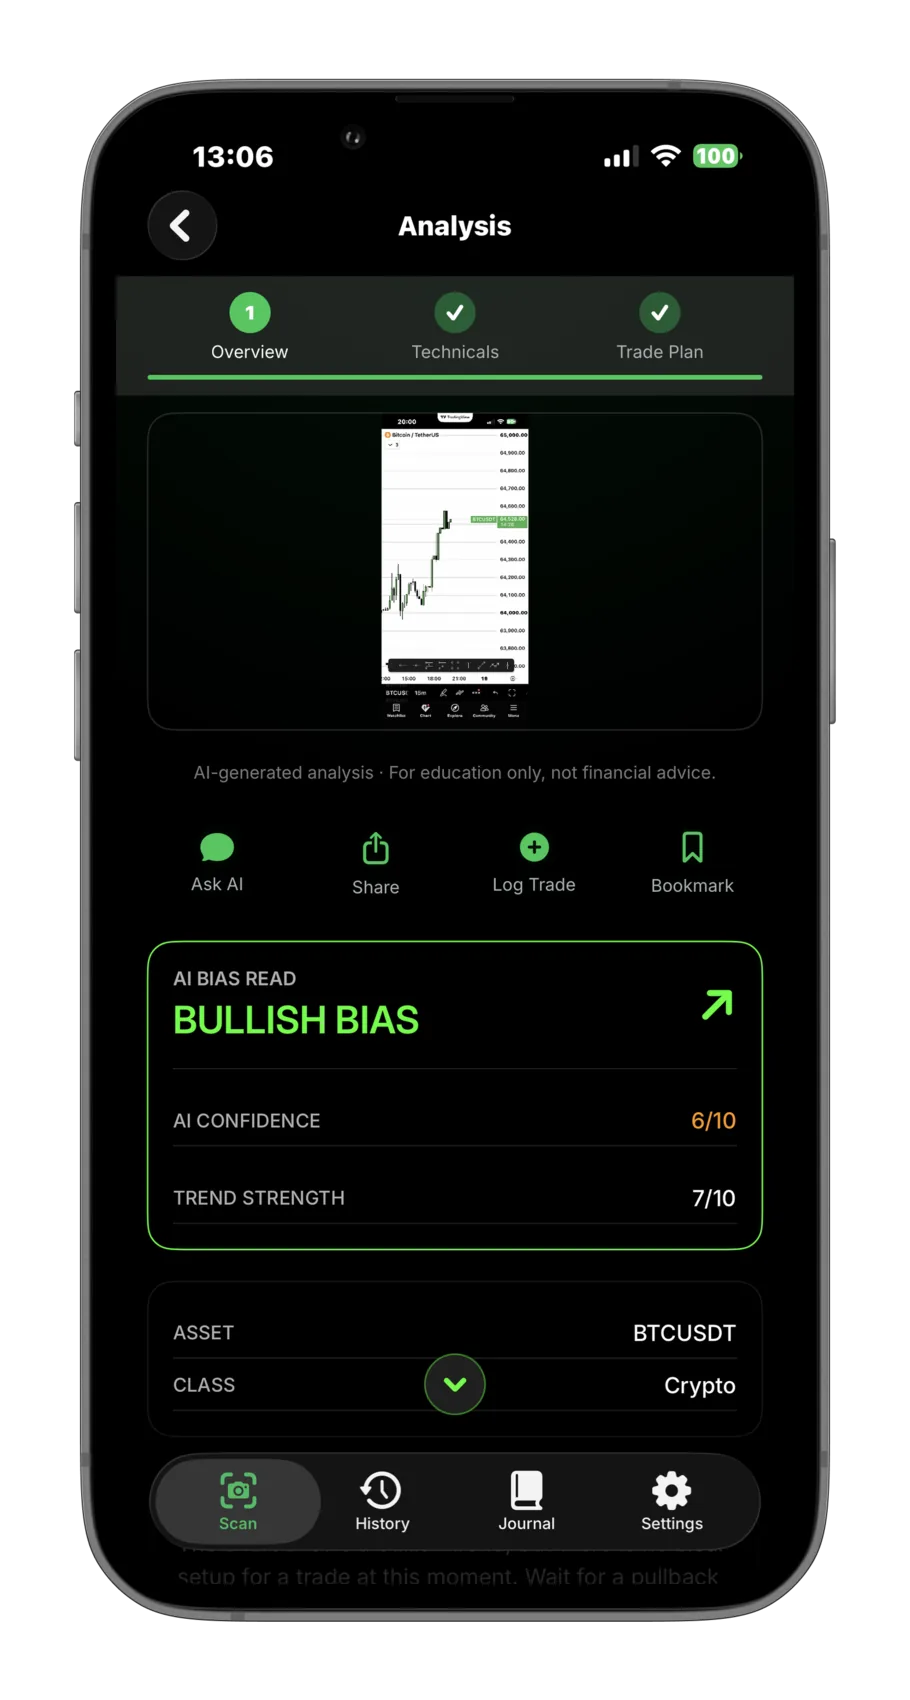
Snap or import any chart and get an instant, structured read: trend, support and resistance levels, detected patterns, and a trade plan with the risk maths already done.


The problem
Turning what you see into a plan you can size, risk and review is where most retail traders come unstuck.
You can see the chart, but not where the setup actually invalidates. Entry, stop and target end up being a feeling rather than a number.

You take the trade, it wins or it loses, and nothing gets learned. There is no honest record of whether your reads hold up over time.
Screenshots in one app, notes in another, a spreadsheet you stopped updating in March. The context is gone by the time you need it.
The loop
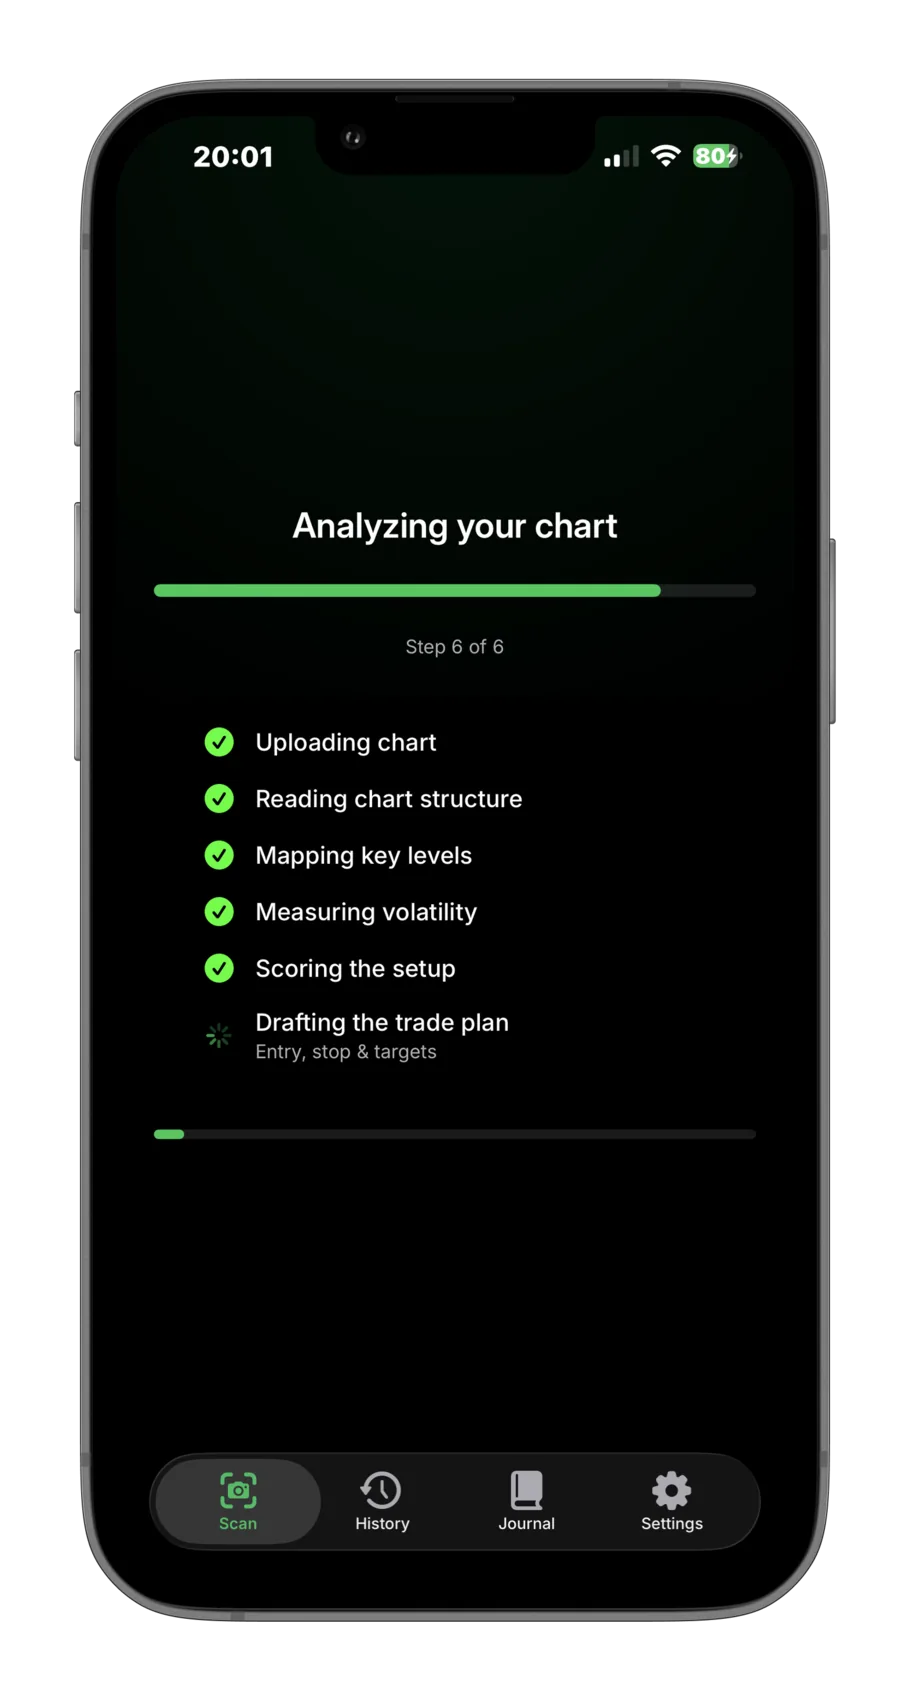
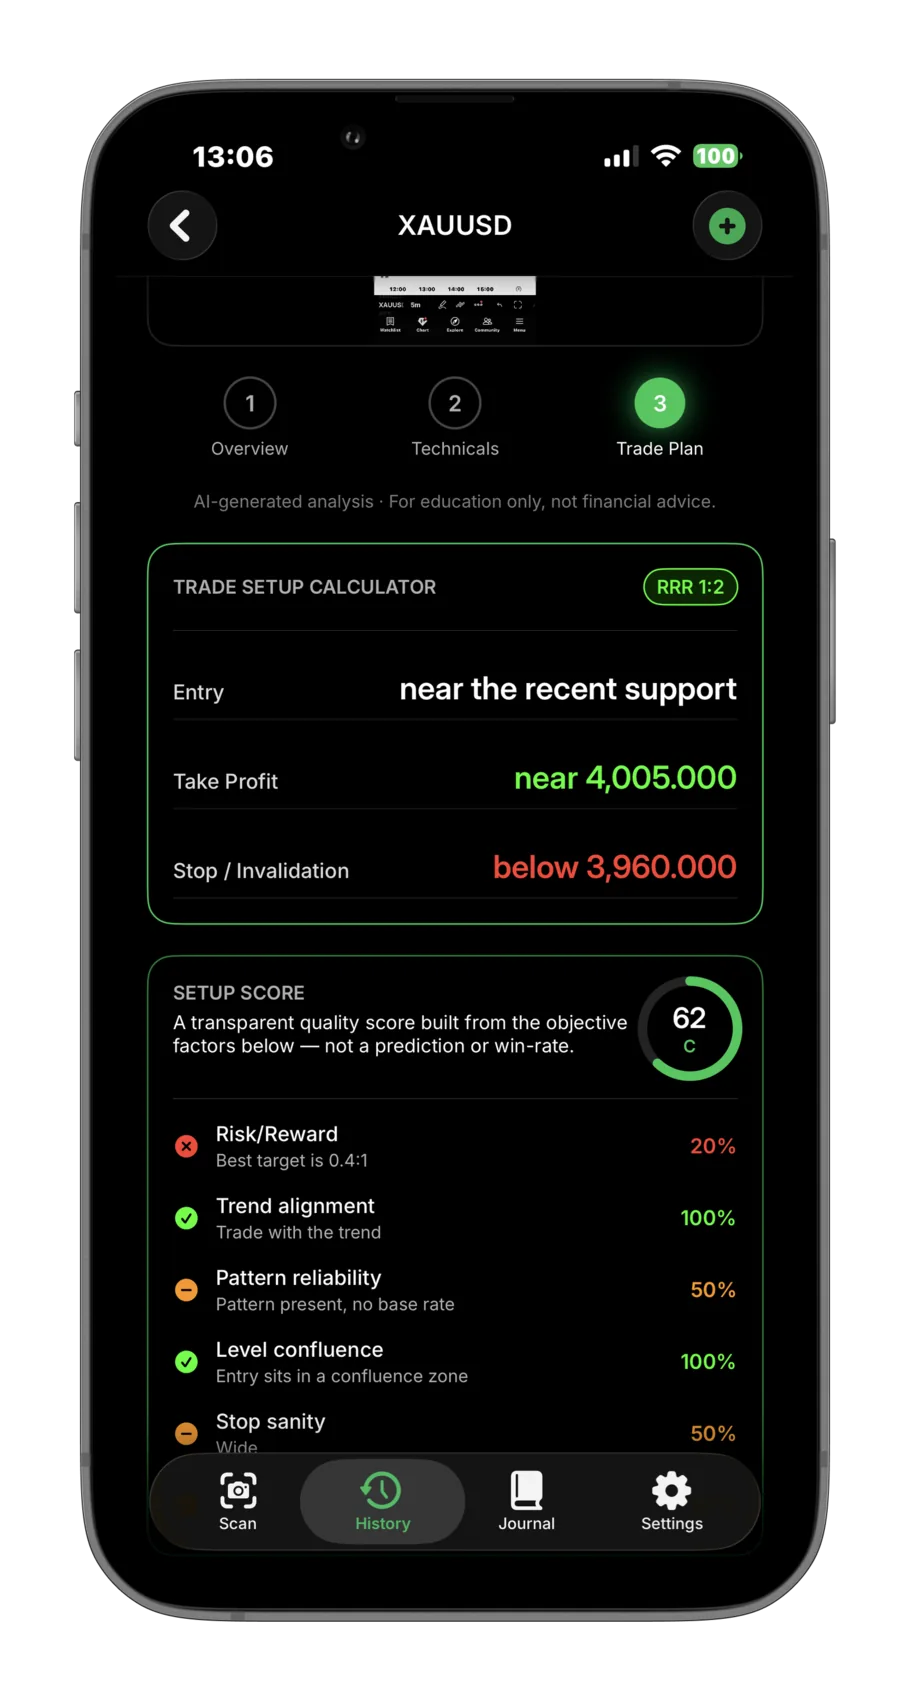
Photograph or import a chart from any platform. An AI vision model reads it and returns trend and its strength, numeric support and resistance, detected patterns, and a trade plan with entry, stop and targets.
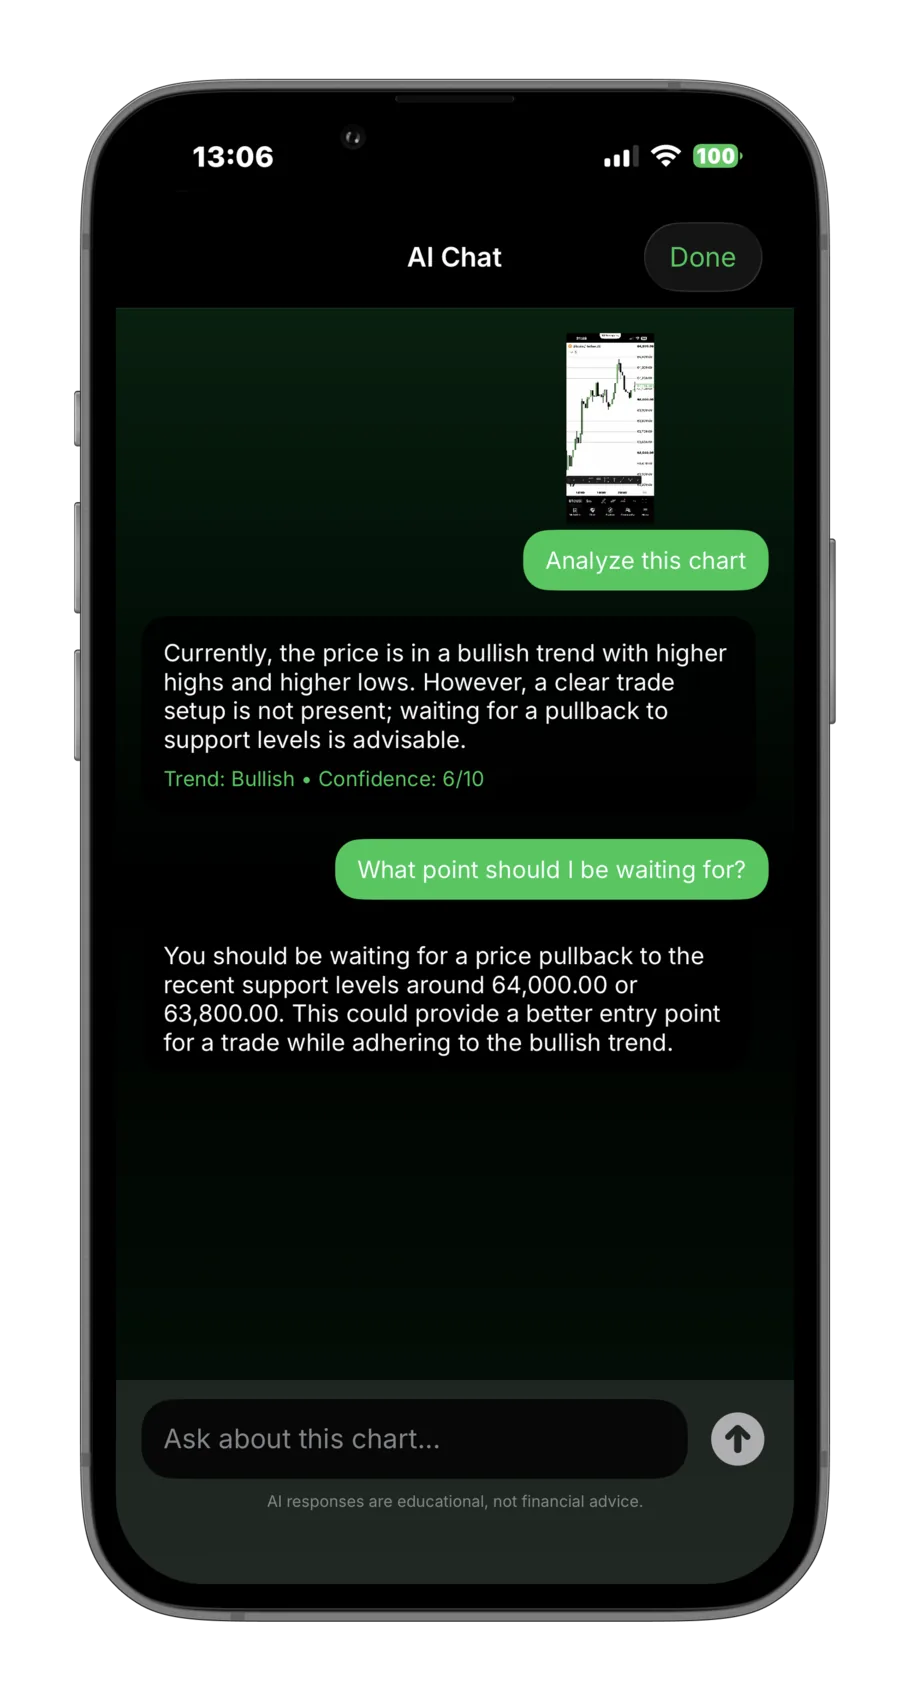
Every analysis comes with a chat that already knows the full context of the read you just got. Ask what invalidates the setup, why a level matters, or how the risk looks before you commit.
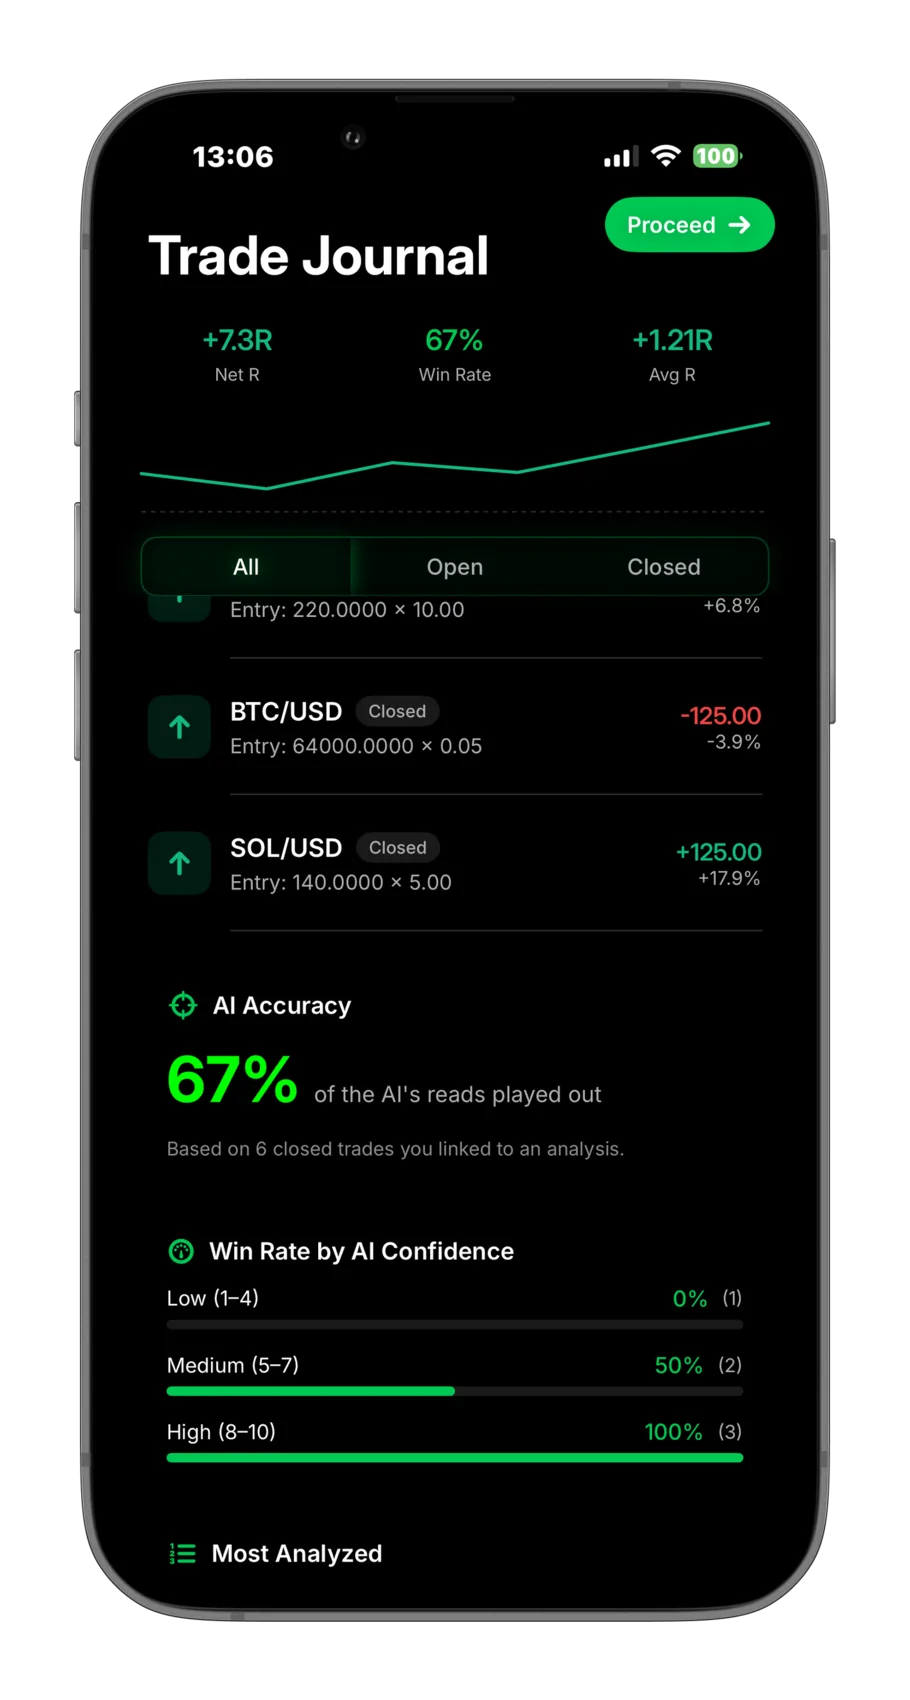
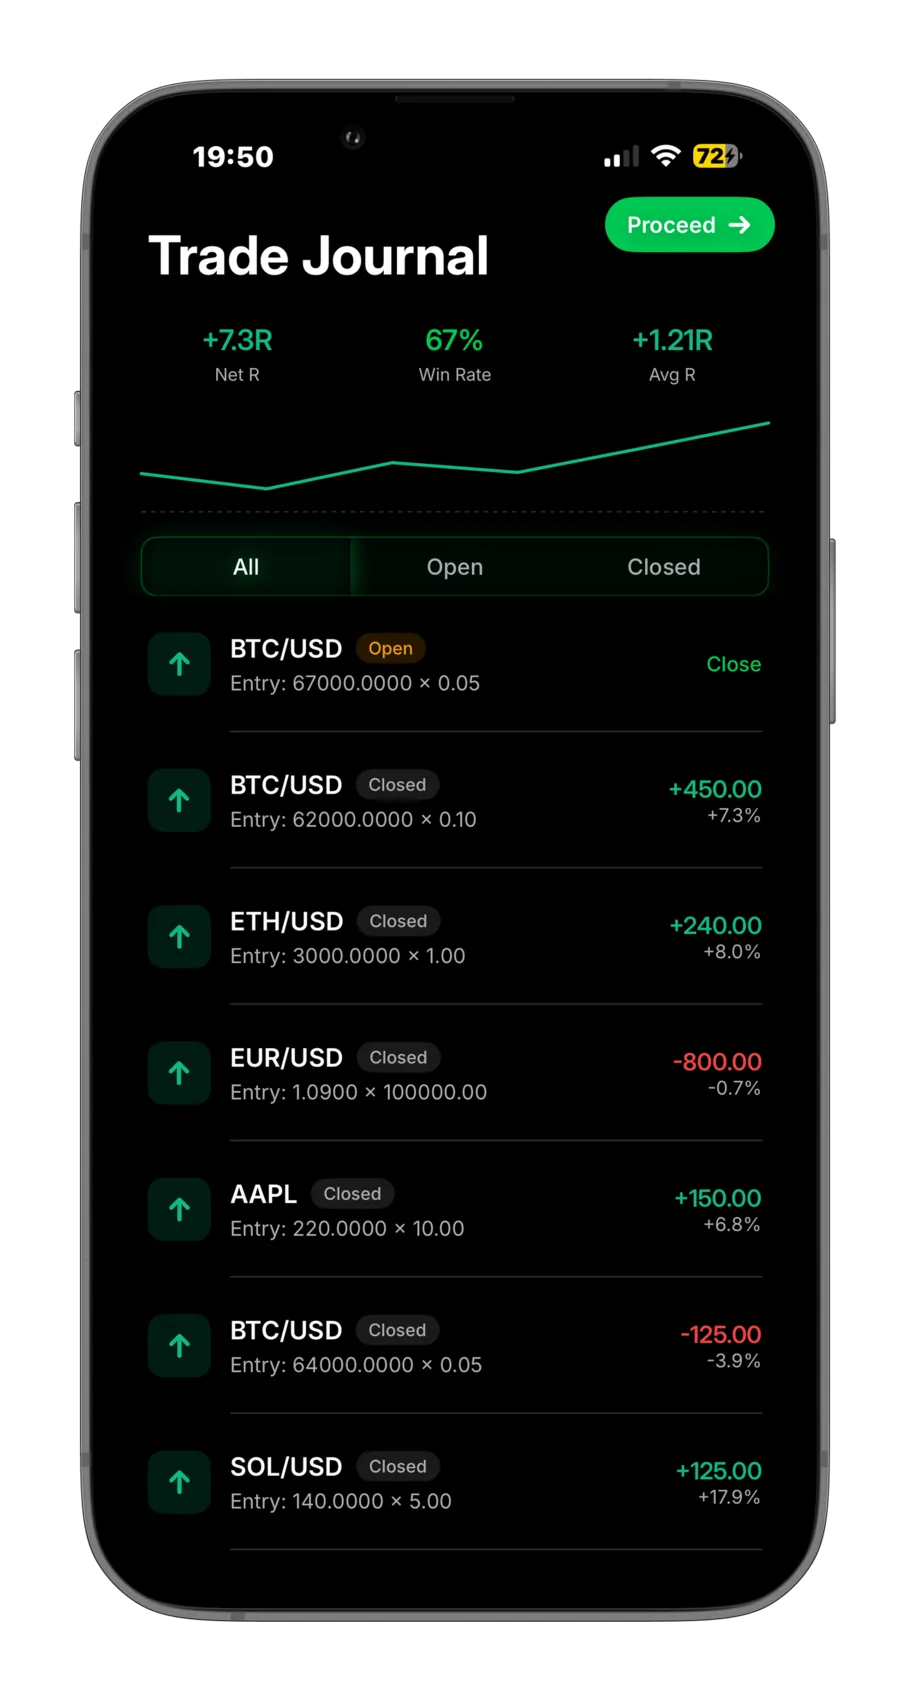
Log the trades you take and close them. Anything logged from an analysis retro-scores that analysis, so the accuracy figure is built from your own outcomes rather than from a marketing claim.
Capabilities
The analysis is the core. These are the parts that make it usable session after session.
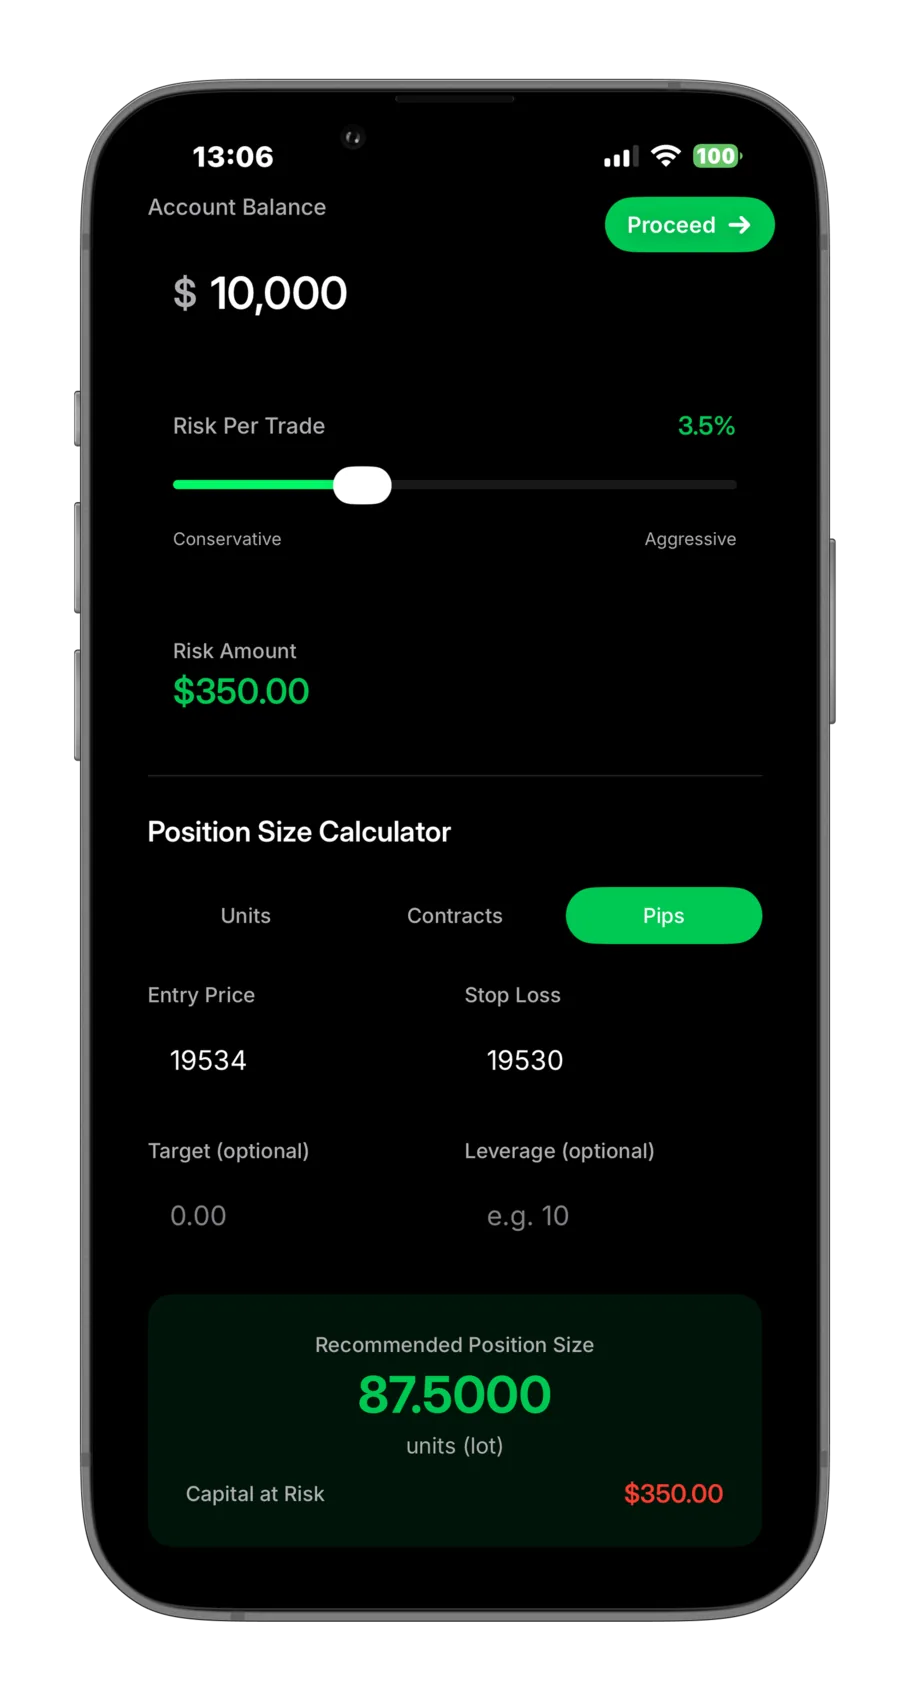
Turn account balance and risk percentage into a position size, an R:R and the margin the trade actually requires. The maths that decides how much you lose when you are wrong.
Save the setups you actually trade. The one you pick rides along with the scan, so the read is framed by your approach instead of a generic one.
Every scan you have run, searchable and filterable, with the original chart image kept beside the read so you can see what the AI was actually looking at.
There is no broker connection and no data feed. If your platform can draw a candlestick chart, CandleScan can read a screenshot of it.


How it works
No account linking, no broker connection, no live data feed. Just the chart in front of you.
Honest by design
That line is written into the AI prompt itself. These constraints override growth optimisation, and they are why the app is worth trusting with a decision.
Of the people who day traded for more than 300 days, 97% lost money. That is from a study of 19,646 retail day traders tracked over five years, not a marketing figure. It is also why the app leads with the stop, the invalidation and the position size: the numbers that decide how much you lose when the read is wrong.
Chague, De-Losso & Giovannetti, Day Trading for a Living? (2020), based on Brazilian securities-regulator records for individuals who began day trading mini-Ibovespa futures between 2013 and 2015. Read the study
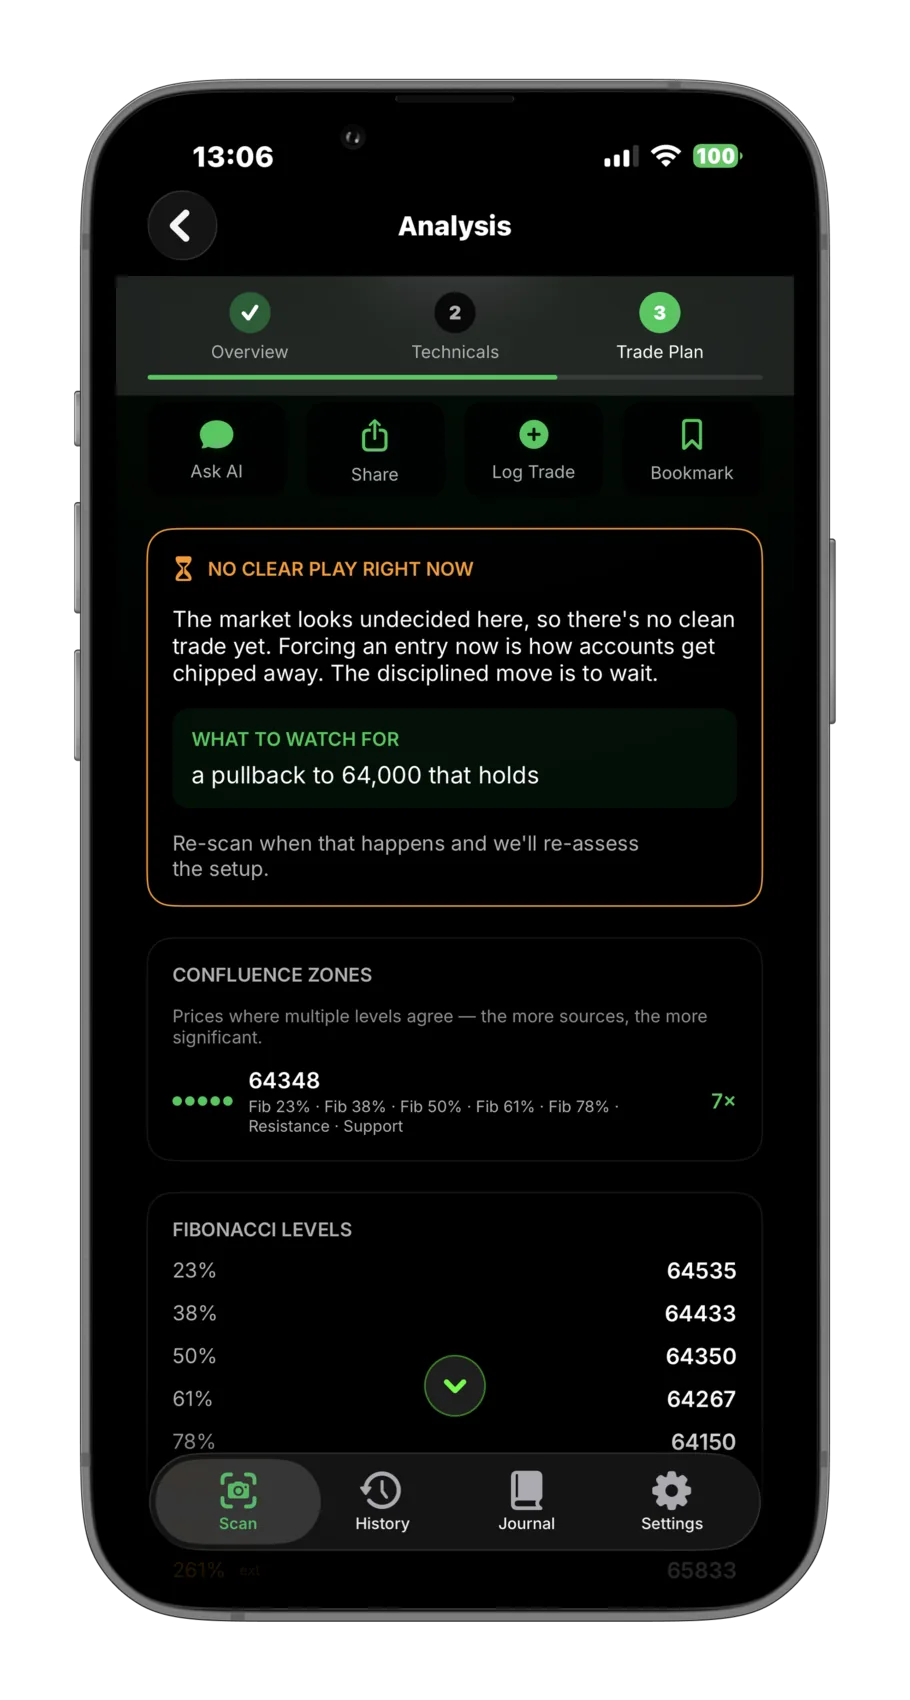
When the chart is genuinely indecisive you get a wait card and what to watch for, not an invented trade plan. Most tools will manufacture a setup because you asked for one.
Pattern base rates carry their source and their caveats. The setup score is labelled a subjective estimate, because that is what it is. When the price axis cannot be read, the numbers are suppressed rather than guessed.
Not a signals service, not a prediction engine, not a financial adviser. It says so on every screen that shows a number, and it will never tell you to take a trade.
Pricing
There is no free tier and no trial. Every plan unlocks the whole app, and you can cancel from your Apple account at any time.


" height="25.27777777777778px" id="a_Qo1XzaZ" transform="translate(1 1)" width="25.27777777777778px"/></svg>)